What are panes?
In Leaflet, map panes group layers together implicitly, without the developer knowing about it. This grouping allows web browsers to work with several layers at once in a more efficient way than working with layers individually.
Map panes use the z-index CSS property to always show some layers on top of others. The default order is:
TileLayers andGridLayersPaths, like lines, polylines, circles, orGeoJSONlayers.MarkershadowsMarkericonsPopups
This is why, in Leaflet maps, popups always show “on top” of other layers, markers always show on top of tile layers, etc.
A new feature of Leaflet 1.0.0 (not present in 0.7.x) is custom map panes, which allows for customization of this order.
The default is not always right
In some particular cases, the default order is not the right one for the map. We can demonstrate this with the Carto basemaps and labels:
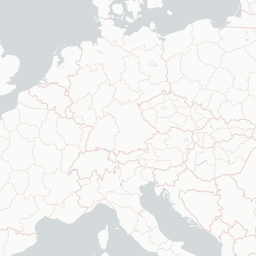
Basemap tile with no labels
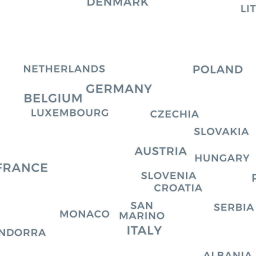
Transparent labels-only tile
Labels on top of basemap
If we create a Leaflet map with these two tile layers, any marker or polygon will show on top of both, but having the labels on top looks much nicer. How can we do that?
| See this example stand-alone. |
Custom pane
We can use the defaults for the basemap tiles and some overlays like GeoJSON layers, but we have to define a custom pane for the labels, so they show on top of the GeoJSON data.
Custom map panes are created on a per-map basis, so first create an instance of L.Map and the pane:
var map = L.map('map');
map.createPane('labels');
The next step is setting the z-index of the pane. Looking at the defaults, a value of 650 will make the TileLayer with the labels show on top of markers but below pop-ups. By using getPane(), we have a reference to the HTMLElement representing the pane, and change its z-index:
map.getPane('labels').style.zIndex = 650;
One of the problems of having image tiles on top of other map layers is that the tiles will capture clicks and touches. If a user clicks anywhere on the map, the web browser will assume she clicked on the labels tiles, and not on the GeoJSON or on the markers. This can be solved using the pointer-events CSS property:
map.getPane('labels').style.pointerEvents = 'none';
With the pane now ready, we can add the layers, paying attention to use the pane option on the labels tiles:
var positron = L.tileLayer('https://{s}.basemaps.cartocdn.com/light_nolabels/{z}/{x}/{y}.png', {
        attribution: '©OpenStreetMap, ©CartoDB'
}).addTo(map);

var positronLabels = L.tileLayer('https://{s}.basemaps.cartocdn.com/light_only_labels/{z}/{x}/{y}.png', {
        attribution: '©OpenStreetMap, ©CartoDB',
        pane: 'labels'
}).addTo(map);

var geojson = L.geoJson(GeoJsonData, geoJsonOptions).addTo(map);
Finally, add some interaction to each feature on the GeoJSON layer:
geojson.eachLayer(function (layer) {
    layer.bindPopup(layer.feature.properties.name);
});

map.fitBounds(geojson.getBounds());
Now the example map is complete!