Zoom levels
Leaflet works with latitude, longitude and “zoom level”.
Lower zoom levels means that the map shows entire continents, while higher zoom levels means that the map can show details of a city.
To understand how zoom levels work, first we need a basic introduction to geodesy.
The shape of the earth
Let’s have a look at a simple map locked at zoom zero:
var map = L.map('map', {
minZoom: 0,
maxZoom: 0
});
var cartodbAttribution = '© <a href="https://www.openstreetmap.org/copyright">OpenStreetMap</a> contributors, © <a href="https://carto.com/attribution">CARTO</a>';
var positron = L.tileLayer('https://{s}.basemaps.cartocdn.com/light_all/{z}/{x}/{y}.png', {
attribution: cartodbAttribution
}).addTo(map);
map.setView([0, 0], 0);
| See this example stand-alone. |
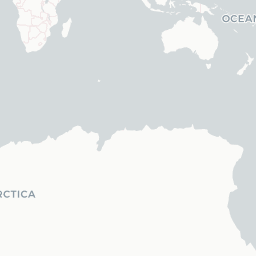
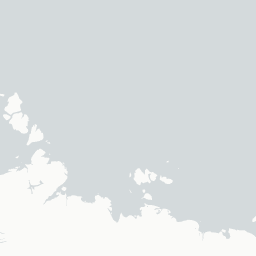
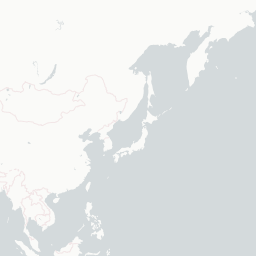
Notice that the “whole earth” is just one image, 256 pixels wide and 256 pixels high:
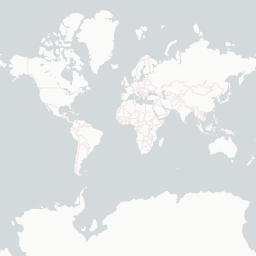
Just to be clear: the earth is not a square. Rather, the earth has an irregular shape that can be approximated to something similar to a sphere.
So we assume that the earth is mostly round. To make it flat, we put an imaginary cylinder around, unroll it, and cut it so it looks square:

This is not the only way of displaying the surface on the earth on a plane. There are hundreds of ways, each of them with its own advantages and disadvantages. The following 6-minute video is a nice introduction to the topic:
Things like geodesy, map projections and coordinate systems are hard, very hard (and out of scope for this tutorial). Assuming that the earth is a square is not always the right thing to do, but most of the time works fine enough, makes things simpler, and allows Leaflet (and other map libraries) to be fast.
Powers of two
For now, let’s just assume that the world is a square:
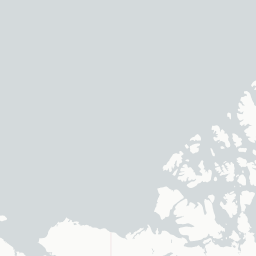
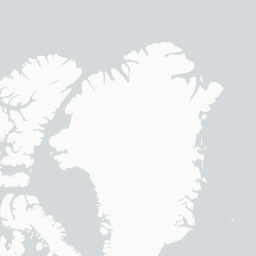
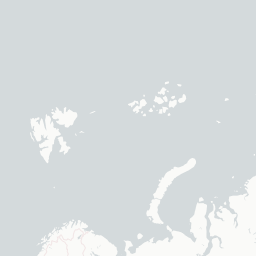
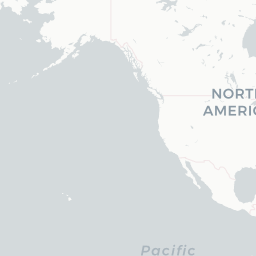
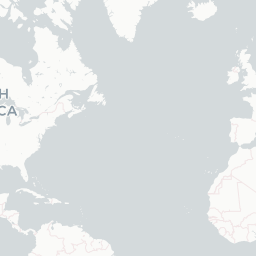
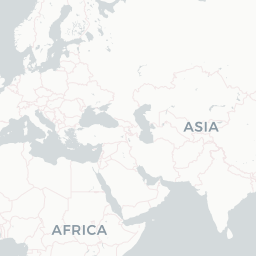
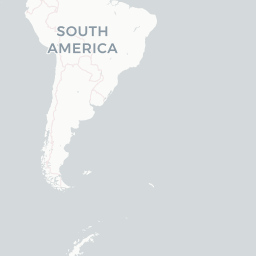
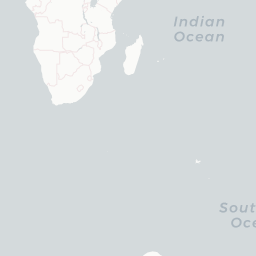
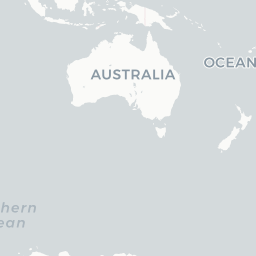
When we represent the world at zoom level zero, it’s 256 pixels wide and high. When we go into zoom level one, it doubles its width and height, and can be represented by four 256-pixel-by-256-pixel images:
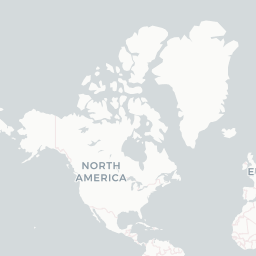
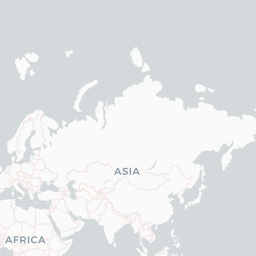
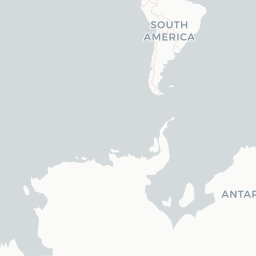
At each zoom level, each tile is divided in four, and its size (length of the edge, given by the tileSize option) doubles, quadrupling the area. (in other words, the width and height of the world is 256·2zoomlevel pixels):
|
|
|
|
| Zoom 0 | Zoom 1 | Zoom 2 |
This goes on and on. Most tile services offer tiles up to zoom level 18, depending on their coverage. This is enough to see a few city blocks per tile.
A note about scale
One of the disadvantages of using a cylindrical projection is that the scale is not constant, and measuring distances or sizes is not reliable, specially at low zoom levels.
In technical terms, the cylindrical projection that Leaflet uses is conformal (preserves shapes), but not equidistant (does not preserve distances), and not equal-area (does not preserve areas, as things near the equator appear smaller than they are).
By adding a L.Control.Scale to a map, and panning to the equator and to 60° north,
we can see how the scale factor doubles. The following example uses
javascript timeouts
to do this automatically:
L.control.scale().addTo(map);

setInterval(function(){
	map.setView([0, 0]);
	setTimeout(function(){
		map.setView([60, 0]);
	}, 2000);
}, 4000);
| See this example stand-alone. |
L.Control.Scale shows the scale which applies to the center point of the map.
At high zoom levels, the scale changes very little, and is not noticeable.
Controlling the zoom
A leaflet map has several ways to control the zoom level shown, but the most obvious
one is setZoom(). For example, map.setZoom(0);
will set the zoom level of map to 0.
This example again uses timeouts to alternate between zoom levels 0 and 1 automatically:
setInterval(function(){
	map.setZoom(0);
	setTimeout(function(){
		map.setZoom(1);
	}, 2000);
}, 4000);
| See this example stand-alone. |
Notice how the images shown at zoom levels 0 and one correspond with the images shown in the previous section!
Other ways of setting the zoom are:
setView(center, zoom), which also sets the map centerflyTo(center, zoom), likesetViewbut with a smooth animationzoomIn()/zoomIn(delta), zooms indeltazoom levels,1by defaultzoomOut()/zoomOut(delta), zooms outdeltazoom levels,1by defaultsetZoomAround(fixedPoint, zoom), sets the zoom level while keeping a point fixed (what scrollwheel zooming does)fitBounds(bounds), automatically calculates the zoom to fit a rectangular area on the map
Fractional zoom
A feature introduced in Leaflet 1.0.0 was the concept of fractional zoom.
Before this, the zoom level of the map could be only an integer number (0, 1, 2, and so on);
but now you can use fractional numbers like 1.5 or 1.25.
Fractional zoom is disabled by default. To enable it, use the
map’s zoomSnap option.
The zoomSnap option has a default value of 1 (which means that the zoom level
of the map can be 0, 1, 2, and so on).
If you set the value of zoomSnap to 0.5, the valid zoom levels of the map
will be 0, 0.5, 1, 1.5, 2, and so on.
If you set a value of 0.1, the valid zoom levels of the map will be 0, 0.1,
0.2, 0.3, 0.4, and so on.
The following example uses a zoomSnap value of 0.25:
var map = L.map('map', {
	zoomSnap: 0.25
});
| See this example stand-alone. |
As you can see, Leaflet will only load the tiles for zoom levels 0 or 1, and will scale them
as needed.
Leaflet will snap the zoom level to the closest valid one. For example,
if you have zoomSnap: 0.25 and you try to do map.setZoom(0.8), the zoom will
snap back to 0.75. The same happens with map.fitBounds(bounds), or when ending
a pinch-zoom gesture on a touchscreen.
zoomSnap can be set to zero. This means that Leaflet will not
snap the zoom level.
There is another important map option related to zoomSnap: the zoomDelta option.
This controls how many zoom levels to zoom in/out when using the zoom buttons
(from the default L.Control.Zoom)
or the +/- keys in your keyboard.
For the mousewheel zoom, the wheelPxPerZoomLevel
option controls how fast the mousewheel zooms in or out.
Here is an example with zoomSnap set to zero:
var map = L.map('map', {
	zoomDelta: 0.25,
	zoomSnap: 0
});
Try the following, and see how the zoom level changes:
- Pinch-zoom if you have a touchscreen
- Zoom in/out with your mousewheel
- Do a box zoom (drag with your mouse while pressing the
shiftkey in your keyboard) - Use the zoom in/out buttons
| See this example stand-alone. |
That concludes this tutorial. Now play with your zoom levels in your maps!